SUMMARY
This is AI generated summarization, which may have errors. For context, always refer to the full article.
![[ANALYSIS] Part 3: Survey says or not](https://www.rappler.com/tachyon/2021/10/tl-sq-part3.jpeg)
Part 3 of 3
This is the third and final part of a three-part series based on the 20th Jaime V. Ongpin Memorial Lecture on Public Service in Business and Government delivered last October 27, 2021. The author thanks his research assistant Mika Munoz for help in preparing the lecture.
![[ANALYSIS] Part 2: Survey says or not](https://www.rappler.com/tachyon/2021/10/duterte-survey-sq.jpeg?fit=449%2C449)
The first part of the series described the science behind sample surveys, while the second part discussed the opinion poll landscape in the Philippines. It described methods and practices used by two firms that have built track records and explained trends in approval/satisfaction ratings of the country’s presidents.
![[ANALYSIS] Part 1: Survey says or not](https://www.rappler.com/tachyon/2021/10/opinion-survey-says-or-not-sq.jpeg?fit=449%2C449)
This third and last part goes into trends in voter preferences data, as well as provides words of advice to the public and media on how to read polls. It also calls upon survey outfits to be transparent about their methods and the persons/institutions funding their operations, as these matters ultimately reflect the credibility of their data, their institutions, and the Statistics discipline and profession.
How accurate have the election surveys been in the last presidential election?
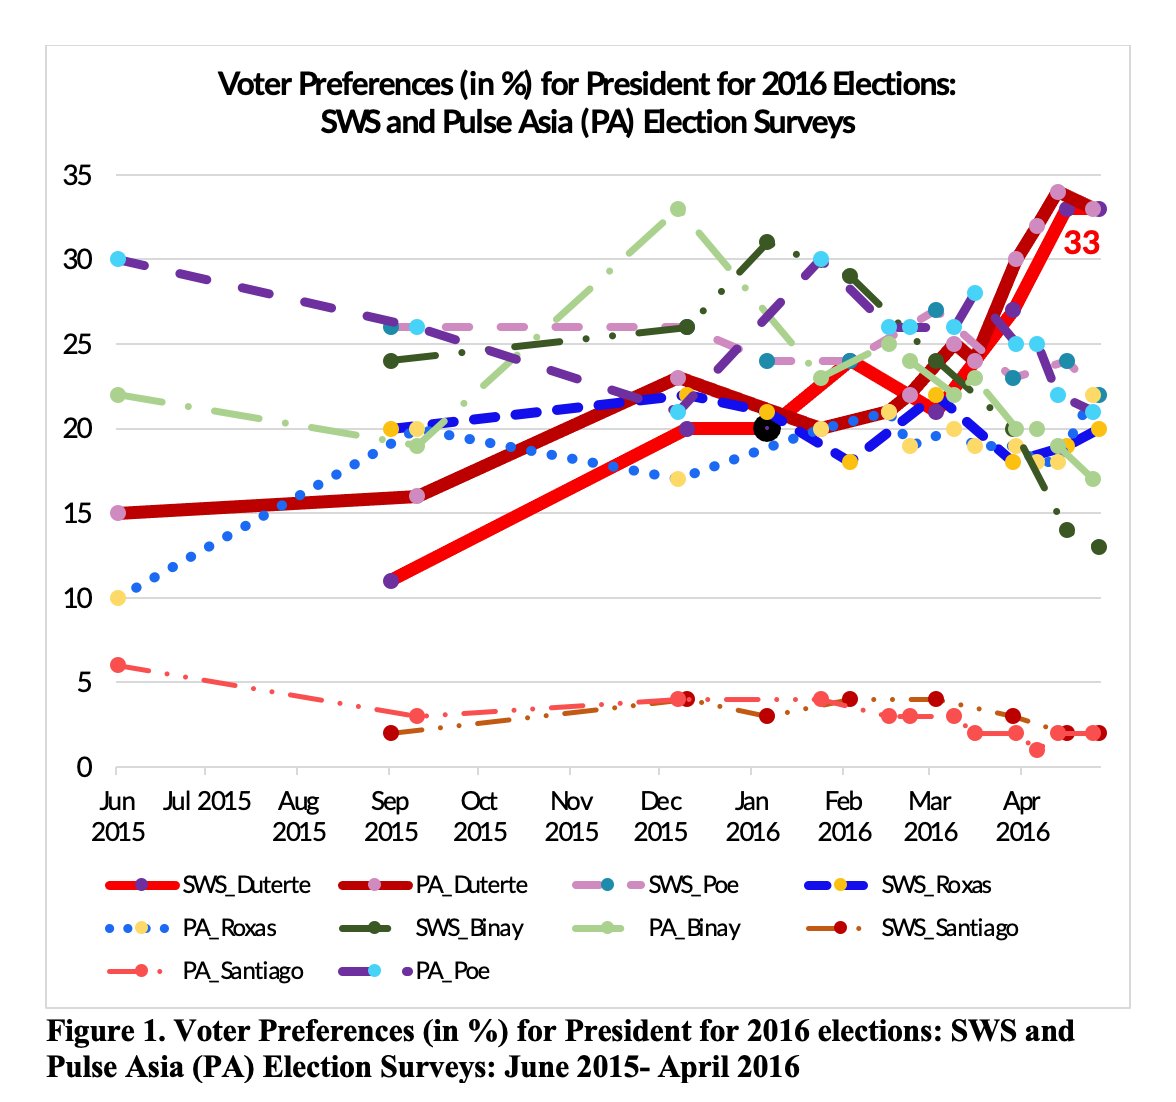
As regards voter preferences, particularly who Filipinos wanted to vote for as president in 2016, we can see that results of polls are not static (Figure 1). In September/October 2015, then vice president (VP) Jojo Binay and Senator Grace Poe were the most preferred presidential candidates, according to results of the Pulse Asia and Social Weather Stations (SWS) surveys, but neither of them won the elections. Rather, then-Davao mayor Rodrigo Roa Duterte won, and interestingly when we look at the last election surveys done by SWS and Pulse Asia, we can see how both firms managed to get an accurate reading of who won, as well as the rankings of the presidential candidates come May 2016.
Duterte’s 39% come election day, however, was underestimated at 33% by both organizations (Figure 2). That may be partially on account of the huge Overseas Filipino Worker (OFW) votes that were in his favor and which were not factored into the polls. Grace Poe landed a close third next to former interior secretary Mar Roxas. The share of VP Jojo Binay who landed fourth, appears to have been overestimated by Pulse Asia, which conducted its poll earlier than SWS. Sample sizes used for both polls were three to four times the regular sample sizes used, yielding supposedly smaller margins of error.
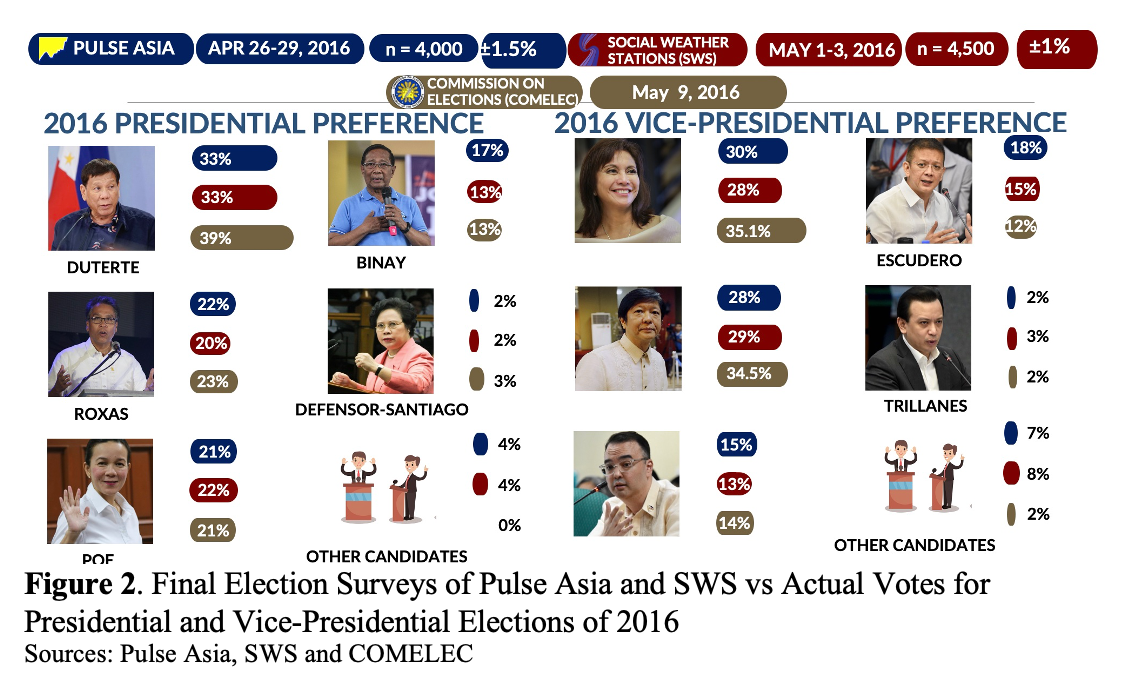
We can conjecture that some social desirability bias may have also come into play in the forecasts, including even with the VP race. Then-senator Chiz Escudero who early on was a front-runner ended up fourth, and his share of votes in the polls also overestimated the actual share of his votes on election day. The close fight between Leni Robredo and Bongbong Marcos was tracked by the polls, and if you examine trends in the election preferences for vice president not shown here, we would also see how the polls managed to capture the increasing trends for Leni Robredo, who at that time, may have benefited from the machinery of the Liberal Party, which was then the administration party.
What about the presidential elections, prior to 2016?
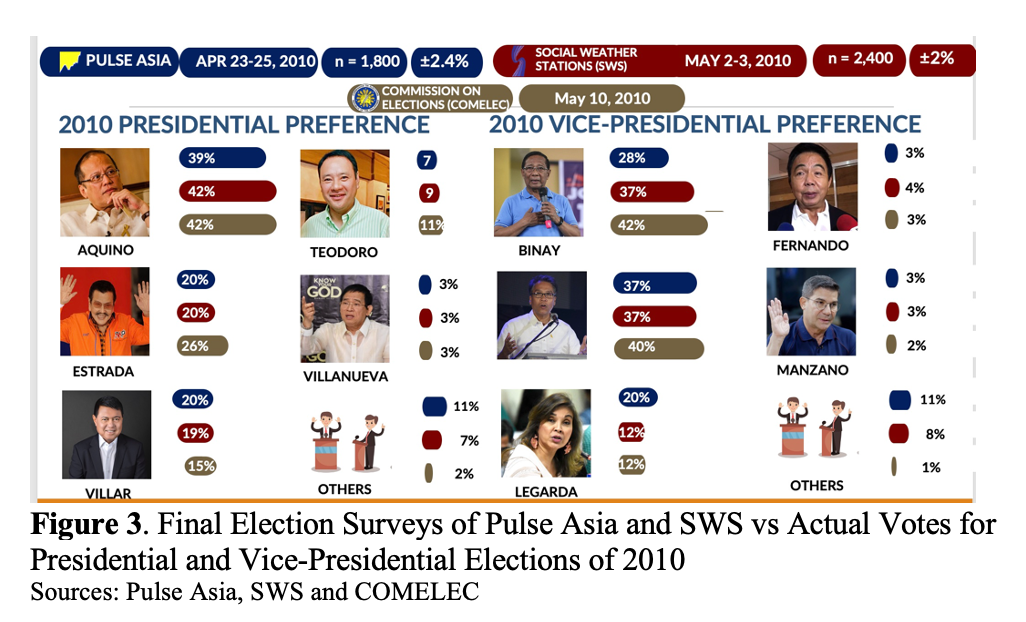
When we look at the election surveys and outcomes in 2010, we similarly see the accuracy of forecasts of SWS and Pulse Asia for the winner of the polls. The estimates of the shares for then-candidate Noynoy Aquino were quite close to the actual share in the elections, with SWS doing a better job than Pulse Asia. Again it should be noted SWS had its poll conducted later and much closer to election day than Pulse Asia. Both SWS and Pulse overestimated the share of Manny Villar, who came in third, and underestimated the Erap votes. This may have been on account of social desirability biases, if respondents were not willing to admit their preference for Erap, and even for Jojo Binay, whose share was also underestimated.
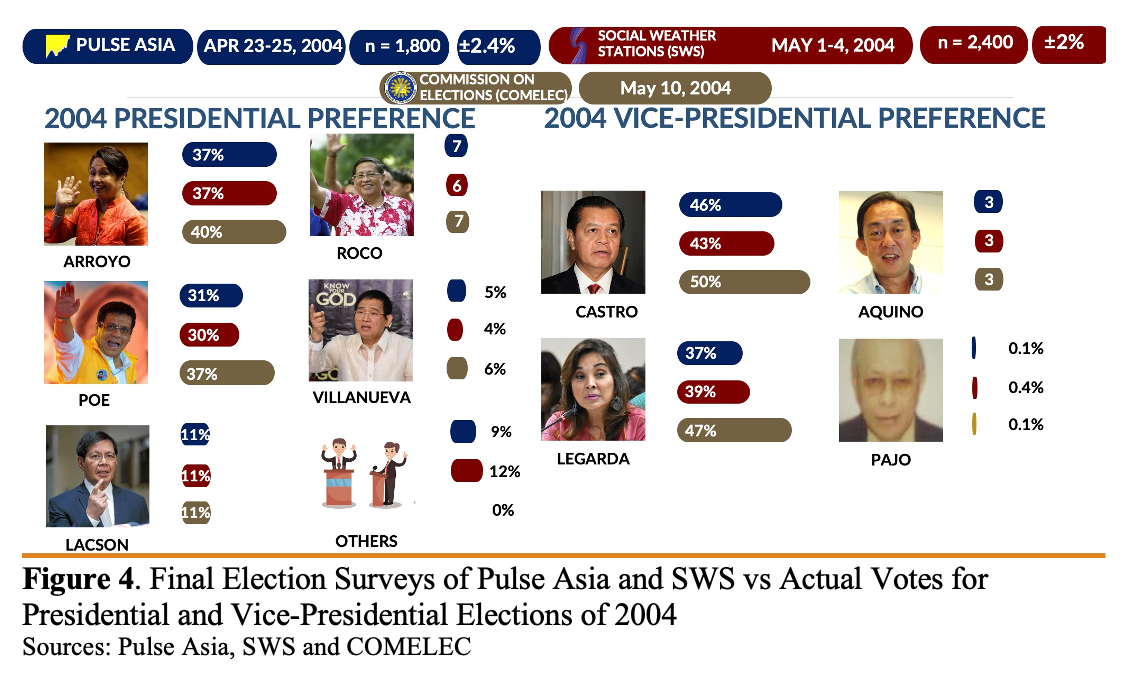
Election forecasts put Gloria Macapagal-Arroyo winning the 2004 elections, although the gap between her and nearest rival Fernando Poe Jr. was actually much closer than the polls could detect, on account of a smaller sample size used in 2004, compared to 2010 and 2016 (Figure 4). The polls in 2004 managed to accurately forecast Noli de Castro winning the vice-presidential race, with SWS picking up a closer fight between De Castro and Loren Legarda, which was correct, again likely on account of their much closer conduct of the polls to election day.
How about the accuracy of polls in forecasting the senators races?
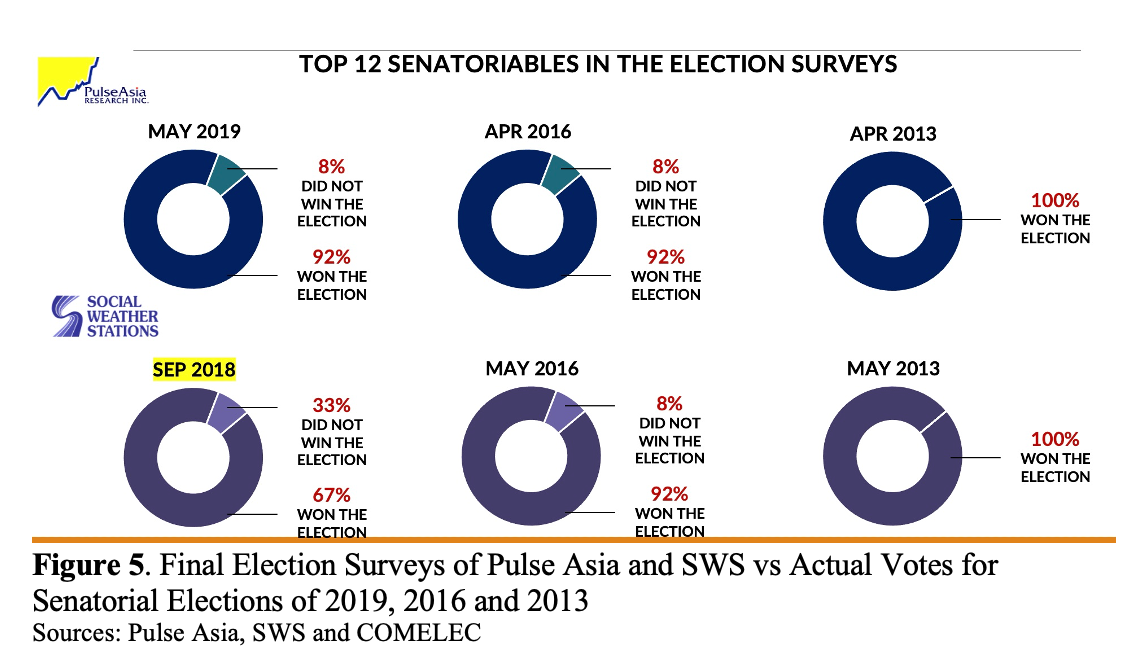
Both SWS and Pulse Asia also have good track records for forecasting the senatorial races. I am not sure though why SWS did not conduct election surveys in 2019, but only in 2018, or if I just could not find these poll results, but their September 2015 listing of the top 12 senators did much poorer in forecasts than the May 2016 Pulse Asia survey, which was done very close to the elections (Figure 5).
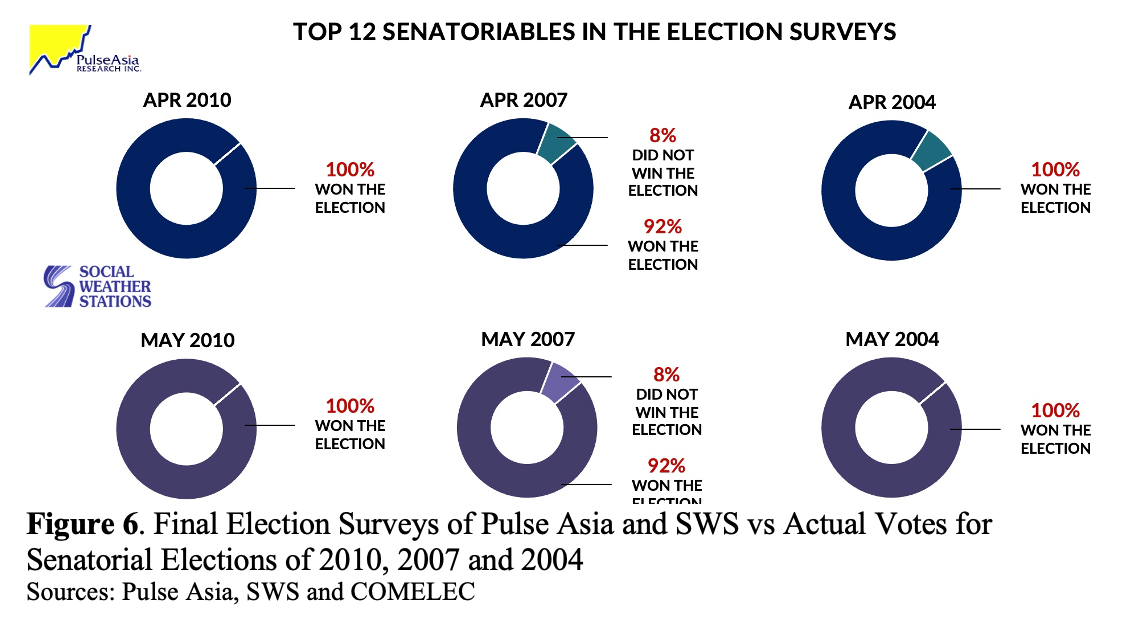
And if we look at the historical data for 2016, 2013, as well as 2010, 2007 and 2004 (Figure 6), we see both organizations managing to do a fairly good job in identifying the winning 12. Just like the voting preferences for president, and vice president, senatorial preferences were changing across time. Why they were changing was clearly an effect of campaign strategies of the candidates, and various events that could trigger changes in voter preferences. As indicated in part 1 of this series, there is little evidence to support the contention that polls influence public opinion.
What other data do SWS and Pulse Asia collect in their surveys?
As I close my discussions, I would like to point out that both SWS and Pulse Asia have been collecting not only approval/satisfaction of Filipinos of the president and various leaders, along with voter preferences, but also a rich set of other data.
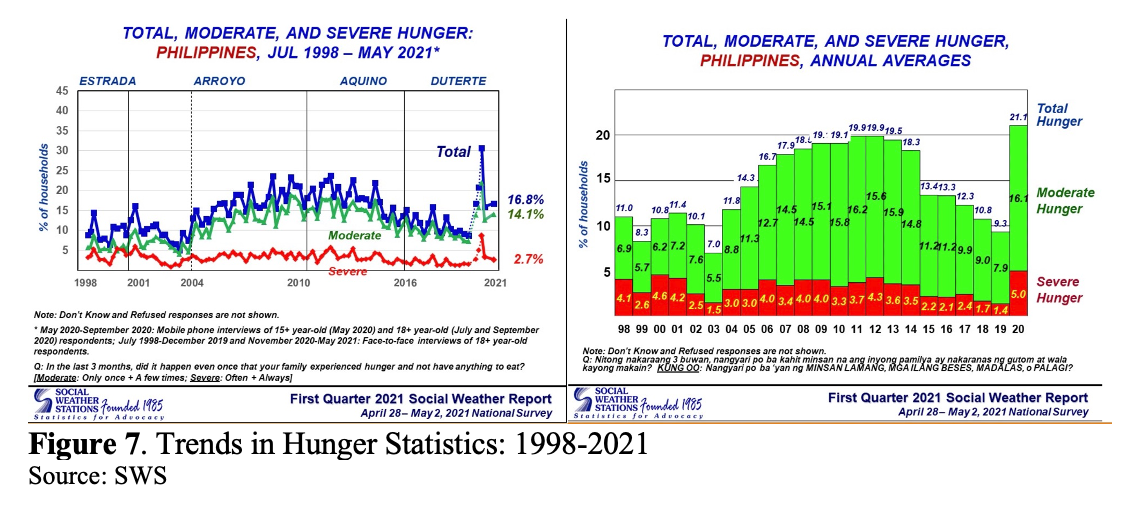
Let me just show one set for SWS: hunger statistics, which during the PNoy and Duterte administrations, displayed a decreasing trend, although the pandemic changed the course of this trajectory. The May 2021 hunger rate of 16.8% is double the December 2019 pre-pandemic level of 8.8% and complements many of the government statistics on the country’s poor economic performance, as well as the rising unemployment amid the pandemic.
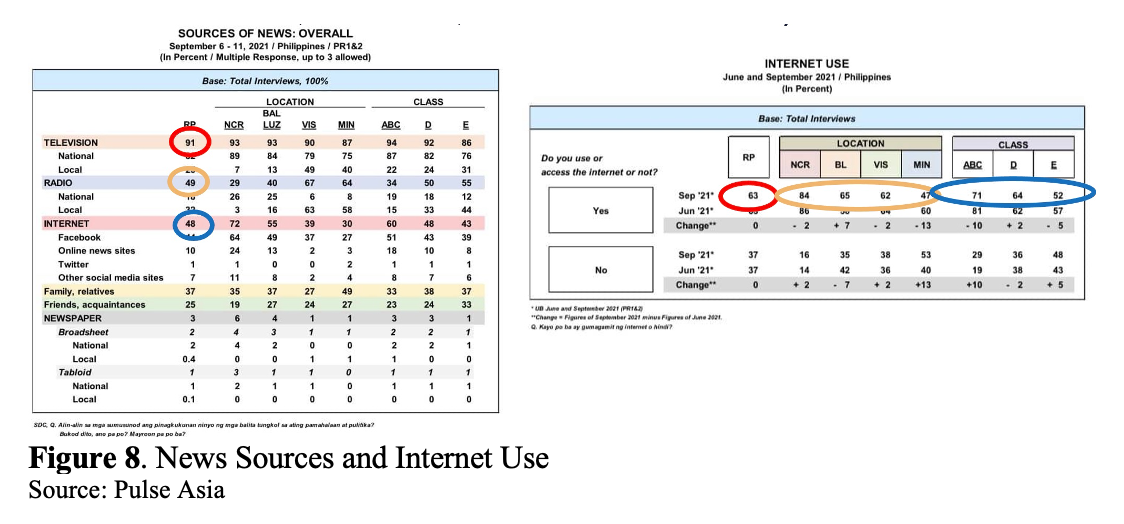
As regards Pulse Asia, let me show you one very interesting set of data they released that I think did not capture as much attention in the news, but provides very good clues on what to do for the campaign. Pulse Asia data shows that 9 in 10 Filipinos use TV as its news source, and less than half use radio or the internet.
Internet penetration is estimated at 63% – biggest across locations in NCR (83%) and least in Mindanao (47%), and with internet penetration correlated to socio-economic class.
These data on access to the internet, radio, and TV have also been more or less generated in surveys of government, particularly the latest 2019 Functional Literacy, Education and Mass Media Survey of the PSA or Philippine Statistics Authority, as well as the 2019 National ICT Household Survey, conducted by the Department of Information and Communications Technology, that shows by and large that TV is still king. And that we have a big problem with our digital divides across locations.
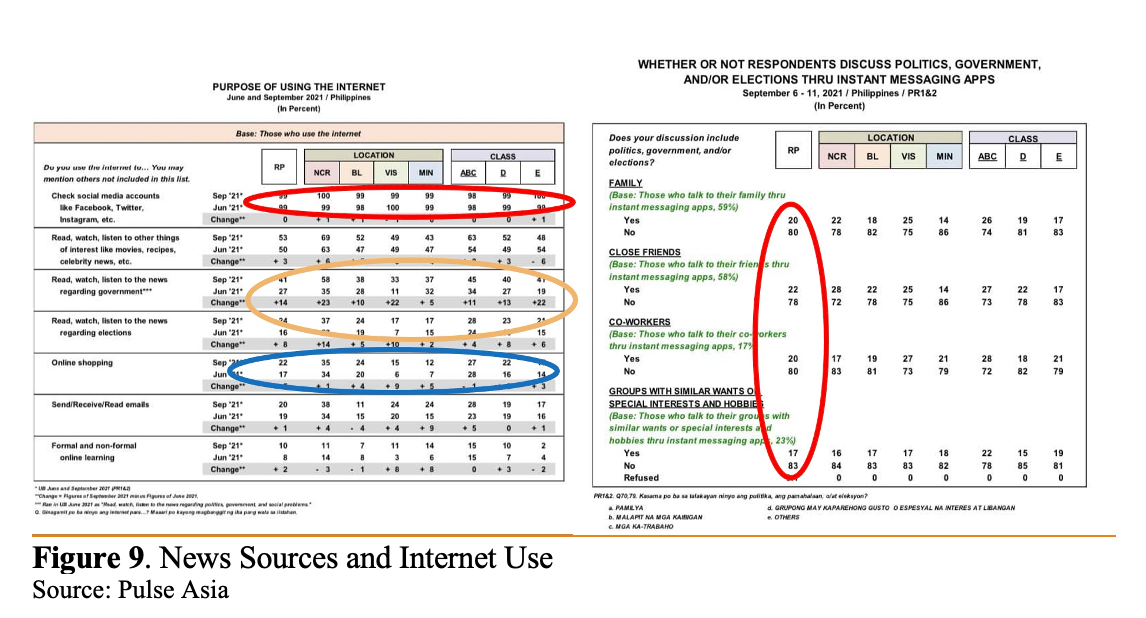
Pulse Asia reveals a lot more about internet use of respondents, which is also consistent with the NICTHS results of DICT, and what many of us know, that of those who have internet access, practically everyone is on social media, especially Facebook. But only less than half use social media for the news, and even fewer use it for news on the elections (Figure 9). Further, only one in five people use internet messaging apps to discuss the elections with family, close friends, and co-workers.
So as far as campaigns are concerned, the bottom line is: TV is still king, so TV ads, possibly debates, and coverage in news will be the main battleground for changing voter preferences.
While we now have a majority online – more however in NCR and among the AB crowd – we actually tend to hear echo chambers, that is, we hear and chat with like-minded people than with family, and close friends when it comes to politics. Filipinos often do not even want to discuss politics. One can validate this by doing an experiment on social media: post something about the elections, e.g., your choice of candidate and why you prefer your candidate over others. Post also something, but this time, something not political at all, a photo of food, a selfie, and see what gets much more response.
So IMHO, we need to get it clear in our heads, that we won’t be able to change views of people on Facebook. Whatever changing of voting preferences will happen, it will be because of TV, and not because of discussions and debates online where we just talk with our like-minded echo chambers, or argue endlessly with people we disagree with, who in the end, we will not “convert.”
Some key takeaways from my talk:
- Survey data says quite a lot! … IF we are willing to listen! And if these surveys are designed
and done well. Many times, we may dispel poll results just because they do not conform to our world view.
- But forecasts of election results are fairly accurate (at least by organizations with good track records) especially with polls done a month before an election.
- SWS and Pulse Asia offer us a lot more than mere voter preference data, they also provide data on how we rate the performance of our leaders, hunger statistics, and a profile of internet/social media use in the country. Unfortunately, not all of these get equal time in the media.
- Surveys may not often offer explanations (for opinions, and why opinions change), but we can have conjectures and validate these with conversations. Those of us who are puzzled by the high approval ratings of Duterte, as pointed out in the second part of this series, may want to check out the lecture of Geoff Ducanes which is available on the SWS website, as well as the fascinating paper of Ronnie Holmes and his co-authors about the social desirability bias in approval ratings.
- All firms conducting polls in the Philippines should be transparent about their methods and funding, not only because that is what is mandated by law, but also because transparency (or the lack of it) can help (or destroy) the credibility of your organizations, your surveys, and ultimately, statistics.
I hope the Marketing and Opinion Research Society of the Philippines (MORES) and the Philippine Statistical Association Inc. (PSAI) can come up with a joint accreditation system of firms conducting surveys to guide the media and the public on what firms are doing a good job, and which aren’t.
The PSAI already has a code of ethics, that could be used as a framework for accreditation. We risk having the public lose trust in statistics and surveys just because some surveys are not representative, and yet they are presented to the public as though they are.
For instance, several days ago, we had a Kalye Survey that claimed to be a random sampling of more than 2,000 people in the streets of Metro Manila and nearby areas, but that’s really called accidental sampling; this survey is not a probability sample. There is value of this tool for qualitative research to probe, for instance, into the reasons for voter preferences.
Or consider another poorly done survey conducted by one of the firms I mentioned earlier, which their website points out, is a nationwide purposive sample of 1,500 respondents drawn by a market research panel of over 200,000 Filipinos maintained by a Singaporean-based firm. No details are given about this Singaporean firm, and on the certainty that this market research panel of 200,000 Filipinos can adequately represent the voting population, or even on why purposive sampling was used.
I suspect that’s why the figures for this survey were way different from the results released by Pulse Asia a few weeks earlier. Nonprobability surveys, including internet surveys conducted even by some media organizations, and the surveys I mentioned earlier cannot be compared with probability surveys, which are designed to represent the country’s voters.
- Finally, how we can “talk back” to surveys:
- First, the public needs to be critical but not overly skeptical of surveys. There are errors in surveys, sampling errors and non-sampling errors, that lead to differences in what a survey says, and what the actual outcomes is. But well-designed surveys tend to give a good snapshot of what people think.
- Politicians and their supporters are advised to be open to accepting survey results, even and especially in times when they don’t show you are ahead, but such a portrait should help you to fine-tune your campaign strategies. Don’t shoot the messenger. Use your kokote!!!
- Finally, to those working in the media, I hope you develop more skillsets to understand survey results and their limitations. You have a great power to guide the public. As was mentioned in the movie Spiderman: “With great power comes great responsibility.”
– Rappler.com
Dr. Jose Ramon “Toots” Albert is a professional statistician working as a Senior Research Fellow of the government’s think tank Philippine Institute for Development Studies (PIDS). Toots’ interests span poverty and inequality, social protection, education, gender, climate change, sustainable consumption, and various development issues. He earned a PhD in Statistics from the State University of New York at Stony Brook. He teaches part-time at the De La Salle University and at the Asian Institute of Management.
Add a comment
How does this make you feel?
![[WATCH] In The Public Square with John Nery: Preloaded elections?](https://www.rappler.com/tachyon/2023/04/In-the-Public-Square-LS-SQ.jpg?resize=257%2C257&crop=414px%2C0px%2C1080px%2C1080px)
![[Newspoint] 19 million reasons](https://www.rappler.com/tachyon/2022/12/Newspoint-19-million-reasons-December-31-2022.jpg?resize=257%2C257&crop=181px%2C0px%2C900px%2C900px)

![[OPINION] The long revolution: Voices from the ground](https://www.rappler.com/tachyon/2022/06/Long-revolution-June-30-2022.jpg?resize=257%2C257&crop=239px%2C0px%2C720px%2C720px)
![[OPINION] I was called a ‘terrorist supporter’ while observing the Philippine elections](https://www.rappler.com/tachyon/2022/06/RT-poster-blurred.jpeg?resize=257%2C257&crop_strategy=attention)

![[New School] Tama na kayo](https://www.rappler.com/tachyon/2024/02/new-school-tama-na-kayo-feb-6-2024.jpg?resize=257%2C257&crop=290px%2C0px%2C720px%2C720px)
![[EDITORIAL] Kapag bumabagsak ang ratings, balikan ang basics](https://www.rappler.com/tachyon/2024/04/animated-bongbong-marcos-sara-duterte-popularity-numbers-2024-carousel.jpg?resize=257%2C257&crop_strategy=attention)
![[OPINION] Can Marcos survive a voters’ revolt in 2025?](https://www.rappler.com/tachyon/2024/04/tl-voters-revolt-04042024.jpg?resize=257%2C257&crop=251px%2C0px%2C720px%2C720px)
![[In This Economy] Economic charter change is very unpopular – it’s time lawmakers listened](https://www.rappler.com/tachyon/2024/04/in-this-economy-charterchange.jpg?resize=257%2C257&crop=292px%2C0px%2C720px%2C720px)
![[OPINION] Ratings fall for Marcos, Duterte is unprecedented. Could it get any worse?](https://www.rappler.com/tachyon/2023/10/tl-approvalratings.jpg?resize=257%2C257&crop_strategy=attention)


There are no comments yet. Add your comment to start the conversation.